What is EMAGE?
EMAGE is a database of in situ gene expression data in the mouse embryo and an accompanying suite of tools to search and analyse the data.
mRNA in situ hybridisation, protein immunohistochemistry, in situ transgenic reporter data, and in situ enhancer data is included. These are sourced from the community and our curators take this data and describe it in a standardised way that allows data query and exchange. The description includes a text-based component but the unique aspect of EMAGE is its spatial annotation focus.
A brief description of the main concepts are given below. For a more in-depth explanation, please refer to this pdf document.
|
 |
||
Schematic representation of the EMAP Mouse Embryo Anatomy Atlas. The panel on the left shows the set of virtual 3D embryos at different stages of development. The panel on the right shows an example of the hierarchically organised anatomy ontology at one stage of development (one 'anatomy tree' exists for each stage of development). The 3D models and the anatomy ontology are linked by 3D regions (shown in the different colours) that have been defined within the virtual embryos that correspond to specific anatomy terms in the ontology. In this example the ontology and domains are shown for the TS07 (~5dpc) embryo. Larger image. |
|
 |
||
The lower panel shows two examples of section data annotation. Both depict views of sections (either 1 or 3 sections) taken from TS12(~8.0dpc) embryos. These have been spatially annotated onto an appropriately matching section plane chosen from the TS12 virtual embryo. Views of the spatial annotations are shown here directly on the virtual section planes and in the 3D context of the virtual embryo model. The accompanying text annotations to terms in the EMAP anatomy ontology (right-hand column), are based on the original descriptions given by the author. Larger image. |
|
|
||
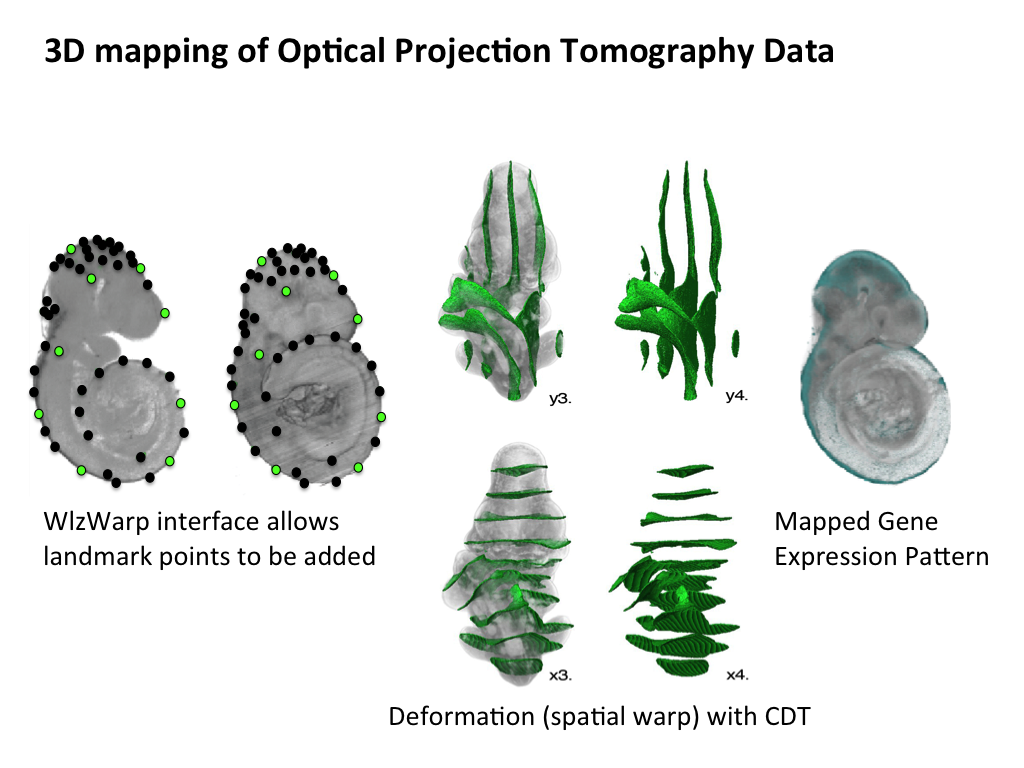
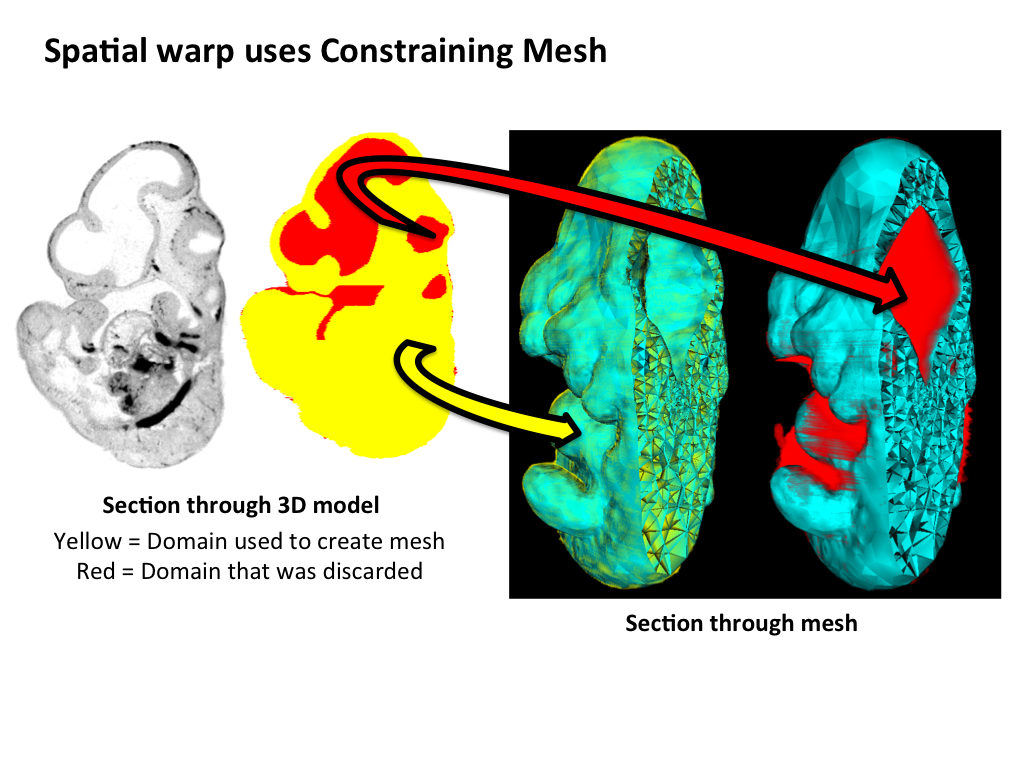
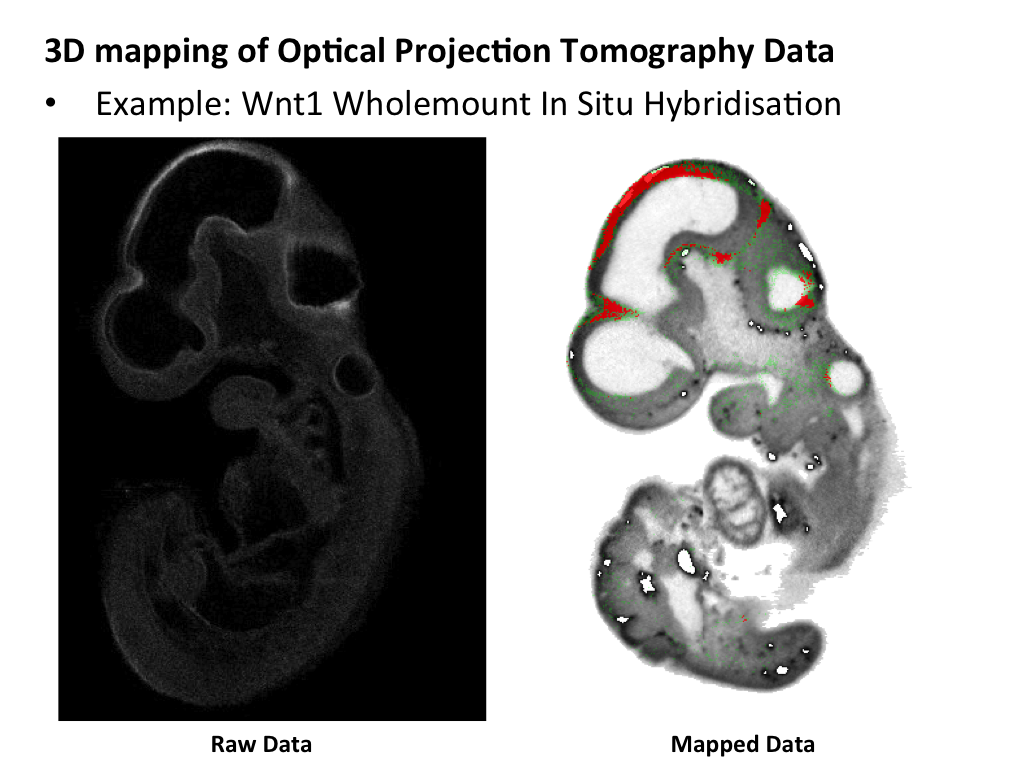
The middle panel highlights the steps that are used to generate a space-filling tetrahedral mesh that is utilised by the CDT. A domain is derived from the embryo model, but not the surrounding space, and this is used to generate a 3D mesh that accurately describes the 3D model. Internal spaces in the embryo, such as the neural lumen of the developing brain, are also omitted from the mesh. The mesh serves to constrain the spatial warp, allowing for an organic deformation of raw image data. The lower panel shows raw OPT data and this gene expression pattern spatially mapped onto a grayscale model. |
- The dual annotation method we use to describe the sites of gene/enhancer expression (i.e. spatial + text) allows EMAGE to be queried by a variety of spatial- or text-based methods. Watch these movies to learn how:

- Search with a gene symbol or name
- 03:29
- 2.2MB (Quicktime)

- Search with a named anatomical structure
- 01:03
- 0.7MB (Quicktime)

- Search with a spatial region
- 05:19
- 3.4MB (Quicktime)

- Features of an EMAGE result list
- 03:19
- 2.6MB (Quicktime)

- Cluster data based on spatial similarlity
- 04:10
- 4.9MB (Quicktime)
 icon to keep this page displayed.)